Monitoring & Metrics
At the moment of writing this documentation, the TANGO Private API server to make the requests is hosted at this link.
TANGO provides a comprehensive monitoring system to track the health, performance, and usage of your models, sessions, and deployments. The infrastructure leverages Prometheus for efficient time-series data collection and Grafana for rich, interactive visualizations.
Workspace supervisors and staff can access monitoring data in two ways:
- Grafana Dashboard: A pre-configured, web-based dashboard for real-time visual monitoring.
- Metrics API: A set of RESTful endpoints for programmatically querying metric data.
This document details both the Grafana dashboard and the API endpoints available for monitoring.
Grafana Dashboard
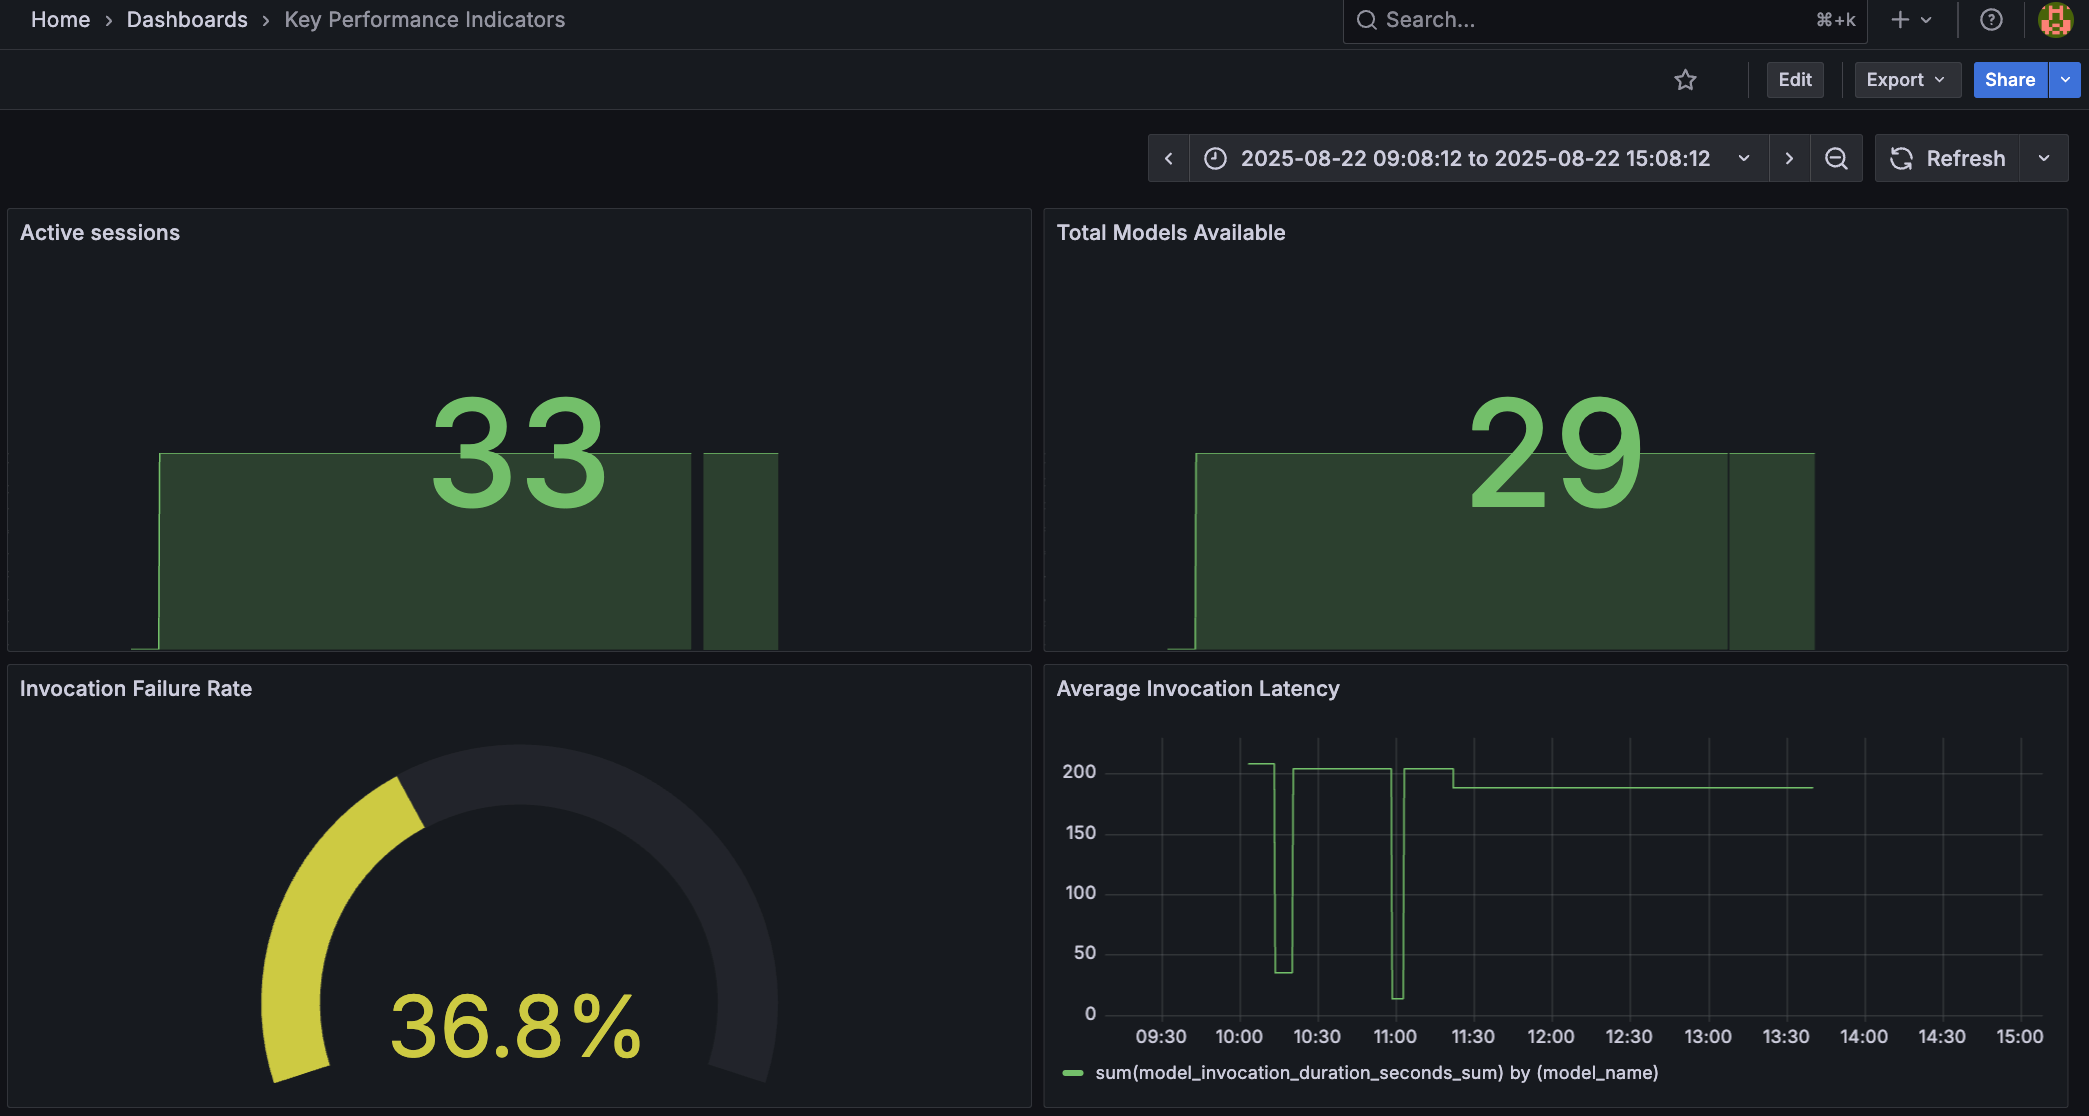
For a high-level, visual overview of the platform's status, TANGO provides a dedicated Grafana dashboard. This dashboard offers an intuitive way to monitor key performance indicators (KPIs) in real-time, helping you quickly identify trends, anomalies, and potential issues.
Key metrics displayed on the dashboard typically include:
- Active session counts.
- Total model invocation failure rates.
- Model invocation latency.
- Total model counts.
Access to the Grafana dashboard is provided to all contributors. Please refer to your TANGO administrator for the URL and login credentials.
Metrics API
The Metrics API provides instead direct access to the underlying Prometheus data.
List Available Metrics
GET /api/metric
Retrieves a list of all queryable TANGO metrics, including their descriptions and available parameters. This endpoint is the starting point for discovering what data you can query.
- Requires bearer token authentication (
bearerAuth).
Available Metrics
The following metrics are available through the API:
| Metric Name | Description | Required Parameters | Optional Parameters |
|---|---|---|---|
active_sessions | Number of active TANGO sessions. | None | model_code, model_version, user_id, workspace |
closed_sessions | Number of closed TANGO sessions. | None | model_code, model_version, user_id, workspace |
total_invocations | Total number of invocations in TANGO. | None | model_code, model_version, status, type |
total_deployments | Total number of deployments in TANGO. | None | workspace, proxy_class, connector_class |
total_models | Total number of models in TANGO. | None | workspace, model_code, model_version |
invocation_failure_rate | Rate of failed invocations in TANGO in percentage. | None | model_code, model_version |
last_model_invocation_duration_seconds | Last model invocation duration in seconds. | model_code, model_version | success |
Response Format
If successful, the endpoint returns a JSON array of metric definition objects.
[
  {
    "name": "active_sessions",
    "description": "Number of active TANGO sessions",
    "prometheus_query": "sum(active_sessions{__PARAMS__})",
    "required_params": [],
    "optional_params": ["model_code", "model_version", "user_id", "workspace"]
  },
  {
    "name": "last_model_invocation_duration_seconds",
    "description": "Last model invocation duration in seconds",
    "prometheus_query": "model_invocation_duration_seconds_sum{__PARAMS__}",
    "required_params": ["model_code", "model_version"],
    "optional_params": ["success"]
  }
]
Retrieve a Specific Metric
GET /api/metric/{metricName}
Fetches the data for a specific metric. You can filter the data by providing parameters as query strings in the URL. This endpoint supports both instant queries (returning the latest value) and range queries (returning data over a period of time).
- Requires bearer token authentication (
bearerAuth).
Path Parameters
| Name | Type | Required | Description | Example |
|---|---|---|---|---|
metricName | string | Yes | The name of the metric to query (from the list above). | invocation_failure_rate |
Query Parameters
Metric-Specific Parameters
These parameters correspond to the required_params and optional_params for each metric, as detailed in the "Available Metrics" table.
- Example: To get the
total_invocationsfor a specific model, you can add?model_code=my-model&model_version=1to your request.
Time-Range Parameters
To perform a range query and retrieve data over a time period, you must provide all three of the following parameters. If none are provided, the API will return the latest instantaneous value.
When performing a range query, you must provide all three parameters: start, end, and step. Providing only one or two will result in an error.
| Name | Type | Required (for range) | Description |
|---|---|---|---|
start | string | Yes | The start of the time range. Can be a UNIX timestamp or an ISO 8601 string (YYYY-MM-DDTHH:MM:SS). |
end | string | Yes | The end of the time range. Can be a UNIX timestamp or an ISO 8601 string (YYYY-MM-DDTHH:MM:SS). |
step | string | Yes | The query resolution step width, specified in seconds (s), minutes (m), hours (h), etc. |
Example: Range Query
This example retrieves the invocation_failure_rate for the model customer-churn-predictor over a 2-hour period, with a data point every 5 minutes.
GET /api/metric/invocation_failure_rate?model_code=customer-churn-predictor&start=2025-08-27T09:00:00&end=2025-08-27T11:00:00&step=5m
Response Format
If successful, the endpoint returns a JSON object containing the metric name, the executed Prometheus query, and the data returned by Prometheus.
{
  "metric": "invocation_failure_rate",
  "query": "sum(total_invocations{status=\"ERROR\",model_code=\"customer-churn-predictor\"}) / sum(total_invocations{model_code=\"customer-churn-predictor\"}) * 100",
  "data": {
    "resultType": "matrix",
    "result": [
      {
        "metric": {},
        "values": [
          [1724756400, "5.2"],
          [1724756700, "5.1"],
          [1724757000, "5.3"]
        ]
      }
    ]
  }
}
An unsuccessful request may return a 400 Bad Request if required parameters are missing or time formats are invalid, a 404 Not Found if the metric name does not exist, or a 502 Bad Gateway if the backend fails to fetch data from Prometheus.